I often have the problem, that there is not enough space for more detail, e.g descriptions, in Charts, which should help the user to understand the reports in an easier way.
But I’ve found a nice feature which is working in the new (Cognos 10) and the old (Cognos 8) chart engine.
You can show more details in the tooltip.
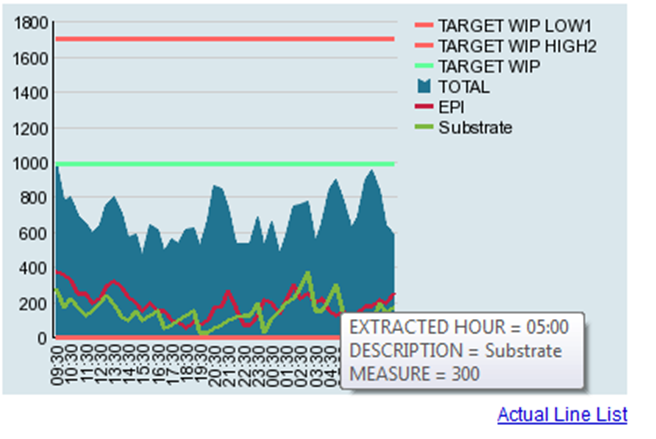
The Cognos tooltip is only showing the label itself, the measure value and the node:
You can enriche the Cognos Tooltip in an easy way…
- Open the report spec in Report Studio
- Go to the chart
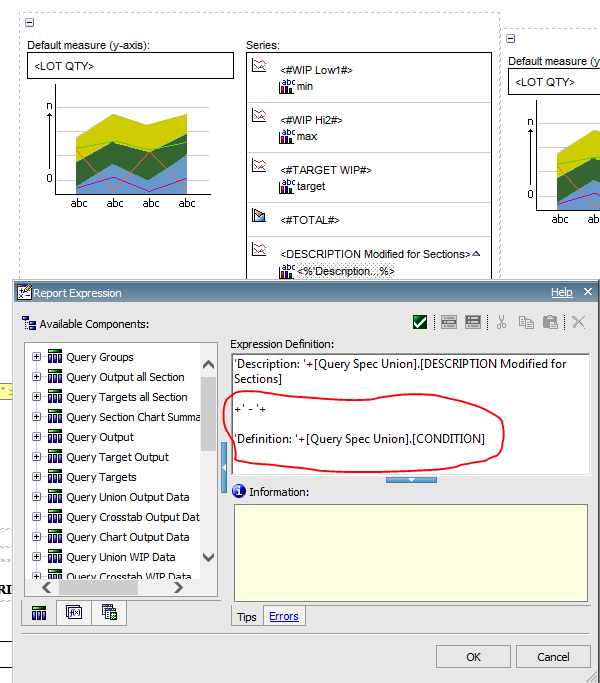
- Set a custom label
- Source Type is Report Expression
- Add an expression:
6. Don’t forget to add the attribute to the properties.
Result:
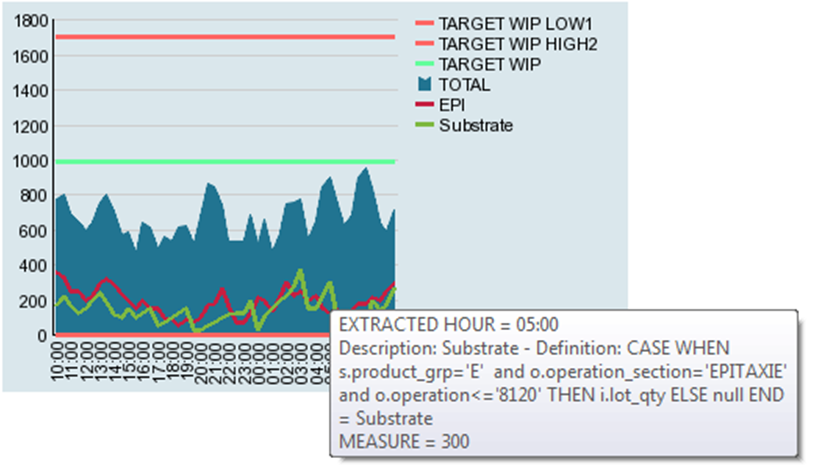
The tooltip is now showing additional informations.